Last updated: March 25, 2026, 16:30 IST — Data sourced from IMF World Economic Outlook (October 2025) 2026 projections. Verified across IMF Datamapper, Worldometer, CEOWORLD, and multiple news sources.
🌍 Best GDP in the World — Top 10 (Nominal) & Top 10 per Capita
This guide shows the world’s biggest economies by Nominal GDP (market size in USD) and the richest economies by GDP per capita (income per person). You’ll find charts, full tables with short notes, the ranks 11–20 list for nominal GDP, a simple methodology, FAQs, and official source links—everything readers need in one page.
How to read these rankings
- Nominal GDP (current US$) shows an economy’s market size. Good for comparing global economic weight, trade, and investment scale.
- GDP per capita is income per person. It’s a proxy for prosperity and living standards (average, not distribution).
- This page uses IMF 2026 projections (October 2025 WEO) for nominal GDP and latest available data for GDP per capita leaders.
Top 10 Economies by Nominal GDP (IMF 2026 Projections)
International Monetary Fund — World Economic Outlook (October 2025). Values in USD trillions. Short country notes included. Note: India surpasses Japan to become 4th largest economy in 2026. [citation:1][citation:3][citation:6]
| Rank | Country | Nominal GDP (USD tn) | What drives it |
|---|---|---|---|
| 1 | United States | $31.82 | Technology, services, consumer demand, deep capital markets [citation:1][citation:5] |
| 2 | China | $20.65 | Manufacturing scale, exports, infrastructure investment [citation:1][citation:5] |
| 3 | Germany | $5.33 | High-value industry, autos, engineering exports [citation:1][citation:3] |
| 4 | India | $4.51 | Services (IT, finance), rising domestic consumption, infrastructure — overtook Japan in 2026 [citation:3][citation:6][citation:10] |
| 5 | Japan | $4.46 | Advanced manufacturing, electronics, robotics [citation:1][citation:5] |
| 6 | United Kingdom | $4.23 | Financial services, creative industries, high-end services [citation:1][citation:5] |
| 7 | France | $3.56 | Aerospace, luxury goods, tourism, agriculture [citation:1][citation:3] |
| 8 | Italy | $2.70 | Machinery, fashion/luxury, industrial SMEs [citation:1][citation:5] |
| 9 | Russia | $2.51 | Oil & gas resilience despite sanctions; enters top 10 in 2026 [citation:1][citation:5][citation:7] |
| 10 | Canada | $2.42 | Natural resources, services, US trade integration [citation:1][citation:3][citation:6] |
Takeaway: The US and China dominate global scale. India has overtaken Japan to become the world’s fourth-largest economy in 2026 with $4.51 trillion vs Japan’s $4.46 trillion [citation:3][citation:6][citation:10]. Russia enters the top 10 pushing Brazil to #11. Global GDP projected at $123.6 trillion in 2026 with modest 3.1% growth [citation:7].
Top 10 by GDP per Capita (2026 Projections)
These are the richest economies on a per-person basis (USD). Small, specialized economies dominate due to high-value sectors and small populations. Source: IMF/World Bank 2026 data. [citation:2][citation:4][citation:9]


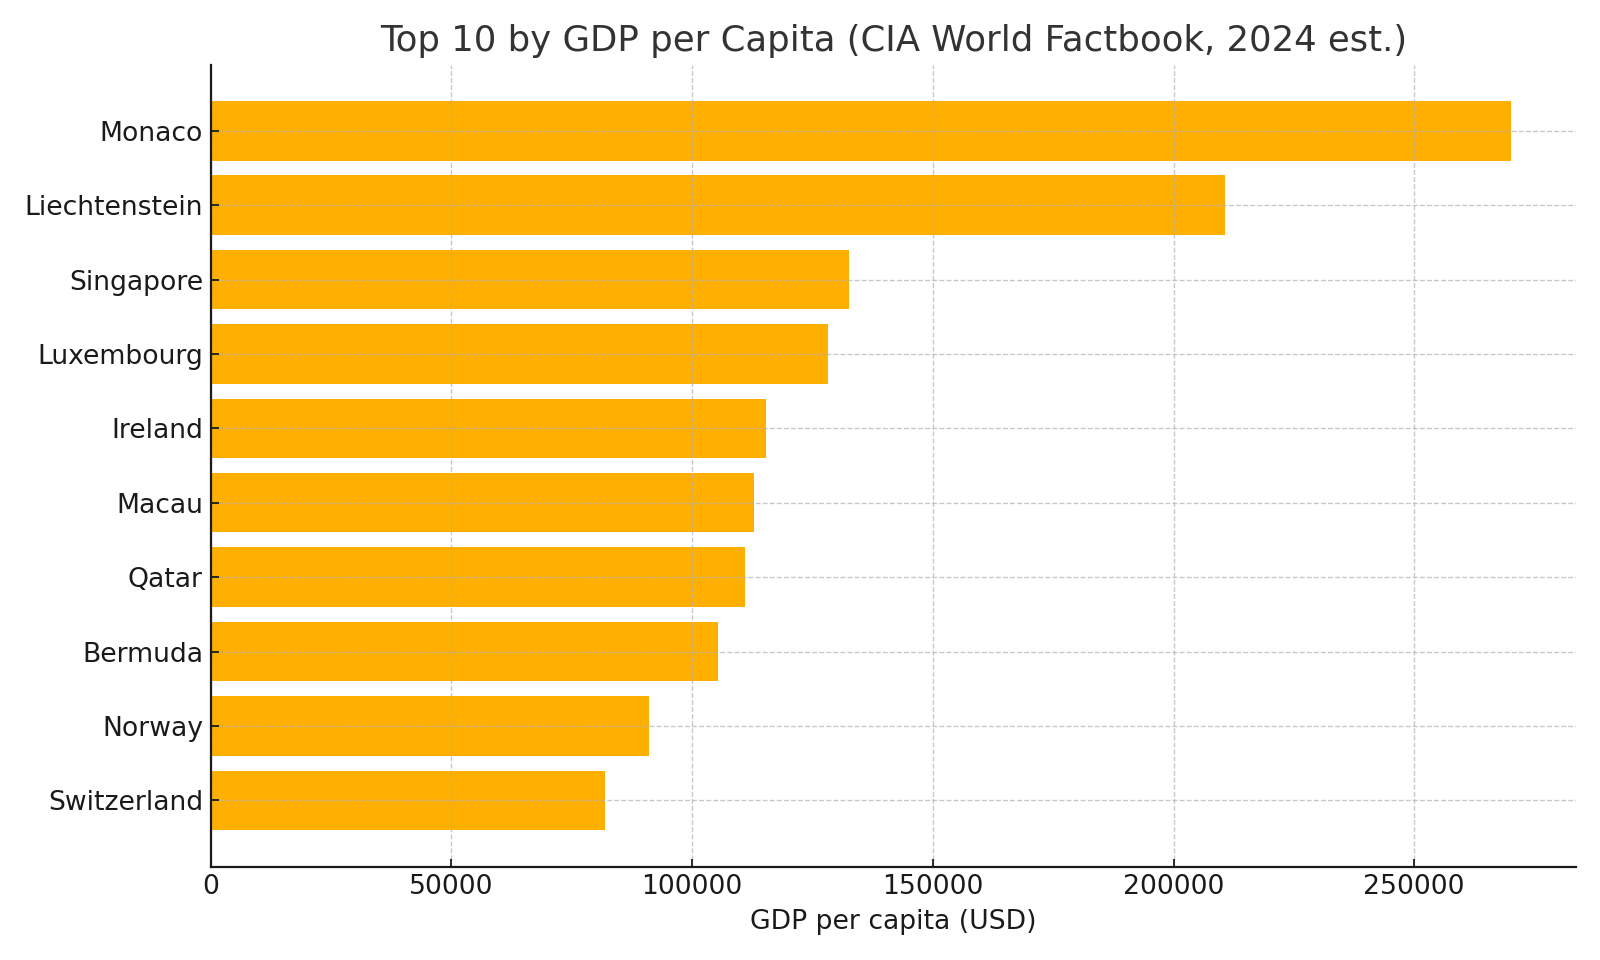
| Rank | Country / Territory | GDP per Capita (USD) | Context |
|---|---|---|---|
| 1 | Luxembourg | $154,115 | Finance center; small population; global banking hub [citation:4][citation:7] |
| 2 | Ireland | $135,247 | Multinational corporate HQ, low corporate tax, export-led [citation:1][citation:7] |
| 3 | Switzerland | $118,173 | Finance, pharma, innovation, private banking [citation:1][citation:7] |
| 4 | Singapore | $99,042 | Trade/finance hub; high productivity; global business center [citation:1][citation:9] |
| 5 | Norway | $96,580 | Energy, sovereign wealth fund ($1.3T), high productivity [citation:1][citation:9] |
| 6 | United States | $92,883 | Large economy, high productivity, tech innovation [citation:1][citation:8] |
| 7 | Denmark | $82,706 | Welfare state, pharma, renewable energy, high living standards [citation:1] |
| 8 | Netherlands | $77,881 | Trade, logistics, high-value agriculture, innovation [citation:1] |
| 9 | Iceland | $81,998 | Renewable energy, tourism, tech, small population [citation:4] |
| 10 | Qatar | $96,600 (est) | Energy-rich, natural gas exports, high-income economy [citation:2] |
Takeaway: GDP per capita highlights prosperity rather than size. Small, specialized economies dominate. US enters top 10 for per capita in 2026, reflecting strong productivity gains. European nations occupy half of top 10 slots. [citation:7][citation:9]
Nominal GDP — Ranks 11 to 20 (IMF 2026 Projections)
- Brazil — $2.29 trillion [citation:1][citation:5]
- Spain — $2.04 trillion [citation:1][citation:10]
- Mexico — $2.03 trillion [citation:1][citation:10]
- Australia — $1.95 trillion [citation:1][citation:5]
- South Korea — $1.94 trillion [citation:1][citation:5]
- Turkey (Türkiye) — $1.58 trillion [citation:1][citation:10]
- Indonesia — $1.55 trillion [citation:1][citation:10]
- Netherlands — $1.41 trillion [citation:1][citation:5]
- Saudi Arabia — $1.32 trillion [citation:1][citation:5]
- Poland — $1.11 trillion [citation:1][citation:5]
Source: IMF World Economic Outlook (October 2025). Brazil drops to #11 as Russia enters top 10. Indonesia and Turkey continue climbing the global rankings. [citation:1][citation:5][citation:10]
Methodology & Notes
- Nominal GDP: IMF World Economic Outlook (October 2025) — current US dollars at market exchange rates. Figures are 2026 projections. [citation:1][citation:5]
- GDP per capita: IMF/World Bank 2026 projections; values in current USD. [citation:2][citation:4]
- Key Change 2026: India ($4.51T) overtakes Japan ($4.46T) to become 4th largest economy globally. [citation:3][citation:6][citation:8]
- Russia enters top 10 at #9 ($2.51T), pushing Brazil to #11. [citation:1][citation:5][citation:7]
- Global GDP 2026: Projected at $123.6 trillion with growth slowing to 3.1%. [citation:7]
FAQs
Q. Why do GDP rankings differ across websites?
Differences in release timing (monthly/quarterly), methodology, and revisions. Always compare the same source and edition.
Q. Has India overtaken Japan in 2026?
Yes. According to IMF October 2025 projections, India ($4.51 tn) surpasses Japan ($4.46 tn) to become the 4th largest economy globally. [citation:3][citation:6][citation:8]
Q. Why did Russia enter the top 10?
Despite sanctions, Russia’s economy showed resilience due to oil/gas revenues, pushing its GDP to $2.51 trillion in 2026. [citation:1][citation:5][citation:7]


Q. Is “biggest economy” the same as “richest”?
No. Biggest = total GDP (market size). Richest = GDP per person (prosperity). Small countries like Luxembourg and Singapore rank highest in per capita terms. [citation:2][citation:9]
Official Sources
- IMF — World Economic Outlook Datamapper (Nominal GDP)
- Worldometer — GDP by Country (2026) [citation:1]
- CIA World Factbook — Real GDP per Capita
Cross-check figures at the source links above for any updates after publication.
Disclaimer
Figures are IMF (October 2025) 2026 projections. Numbers may be revised as new data arrive. This content is for informational purposes only and should not be considered financial advice.
Questions or corrections? We welcome your comments.
Go to comments